
Edmonton Residential Property Value Analysis
My Role
Solo analyst. I independently scoped, cleaned, analyzed, and visualized a dataset of over 400,000 property records as a capstone project for M2M Tech's DataTalent program.
The Question
Edmonton's residential real estate market spans enormously diverse neighbourhoods. I wanted to understand: what factors correlate most strongly with property values, which neighbourhoods sit at the extremes, and how are properties distributed across price ranges?
This wasn't just a technical exercise — the same questions matter to city planners making development decisions, homeowners assessing their market position, and real estate professionals advising clients. Data-driven analysis at this level is what separates informed decisions from guesswork.
So What — A Product Lens
For a product team building tools for city planners, homeowners, or real estate professionals, an analysis like this shapes feature prioritization. A tool built for city planners needs ward-level and zoning aggregations. A tool for individual homeowners needs neighbourhood comparisons and percentile context. The same underlying data serves completely different user needs depending on who you're building for, which is why understanding your user segment before building your data product matters as much as the analysis itself.
Skills Demonstrated
Python · Pandas · NumPy · Bokeh · Data cleaning · Statistical analysis · Data visualization · Google Colab · Analytical storytelling
📎 Watch the recorded presentation → 📎 View the code on GitHub →
Approach.
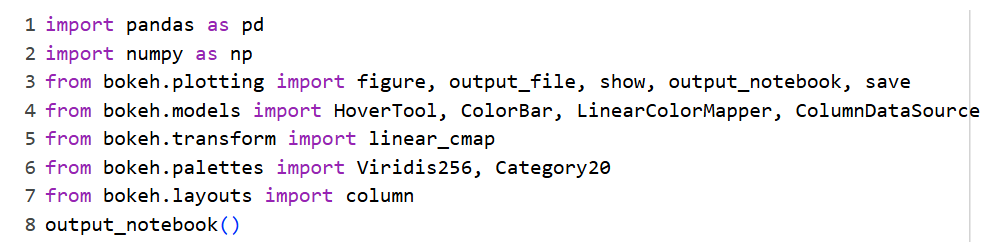
Using Python in Google Colab with Pandas, NumPy, and Bokeh, I:
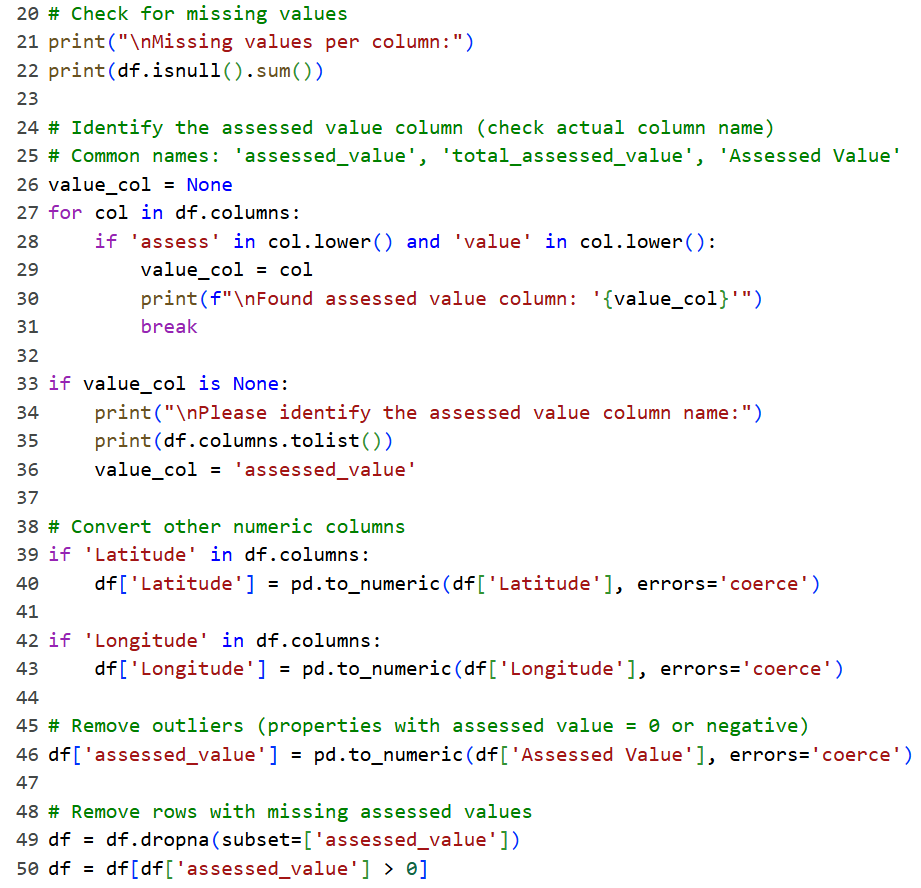
Cleaned and pre-processed the dataset (handled missing values, converted columns, removed outliers, and filtered for residential properties only)
Ran descriptive statistics and percentile analysis across the full dataset
Computed neighbourhood and ward-level summaries
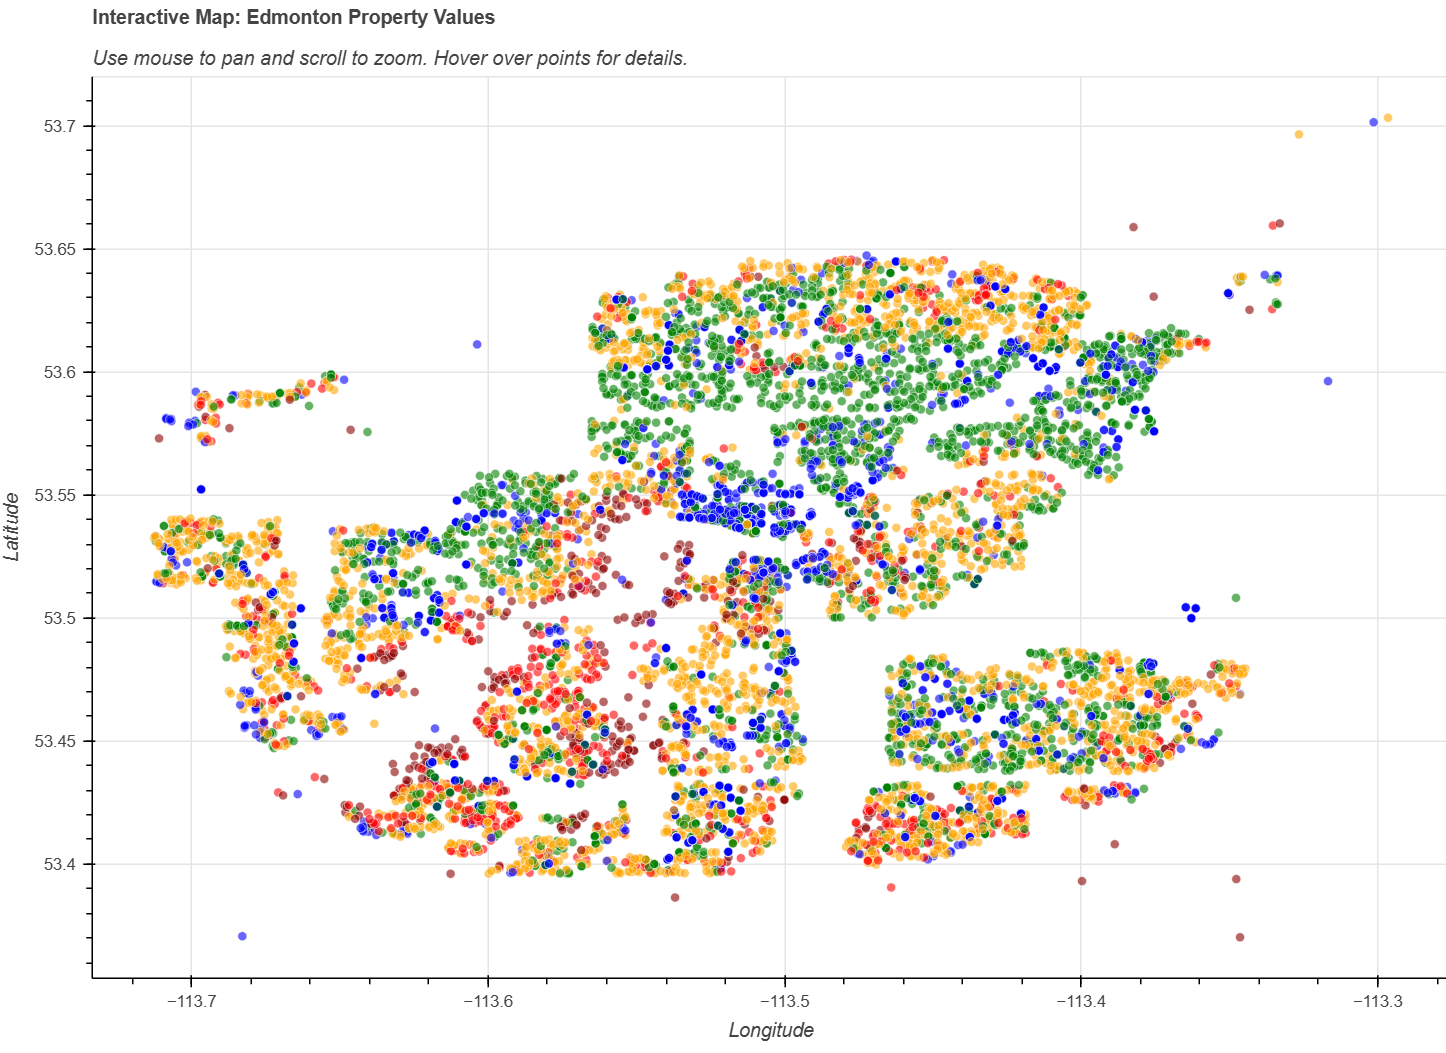
Built 6 visualizations, including an interactive HTML visualization with hover tooltips and zoom
Basic Statistics and Percentiles.
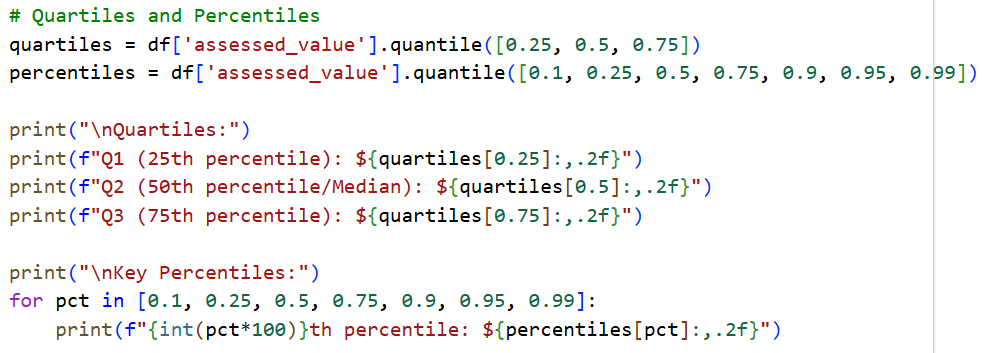
10th
$15,500.00
25th
$185,000.00
50th/Median
$367,500.00
75th
$490,000.00
90th
$632,500.00
95th
$757,500.00
99th
$1,236,500.00
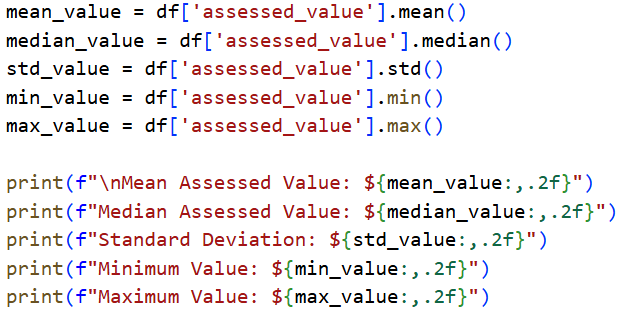
Mean
$370,925.80
Median
$367,500.00
Standard Deviation
$308,491.59
Minimum
$500.00
Maximum
$25,361,500.00
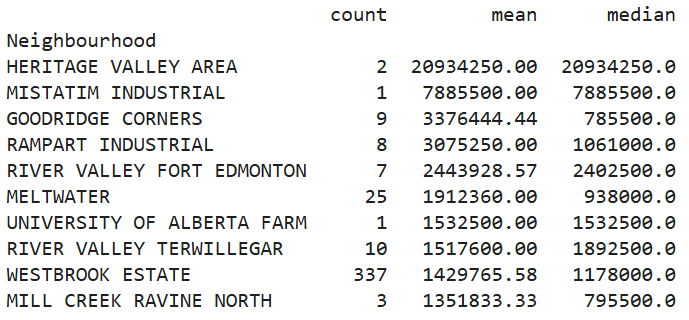
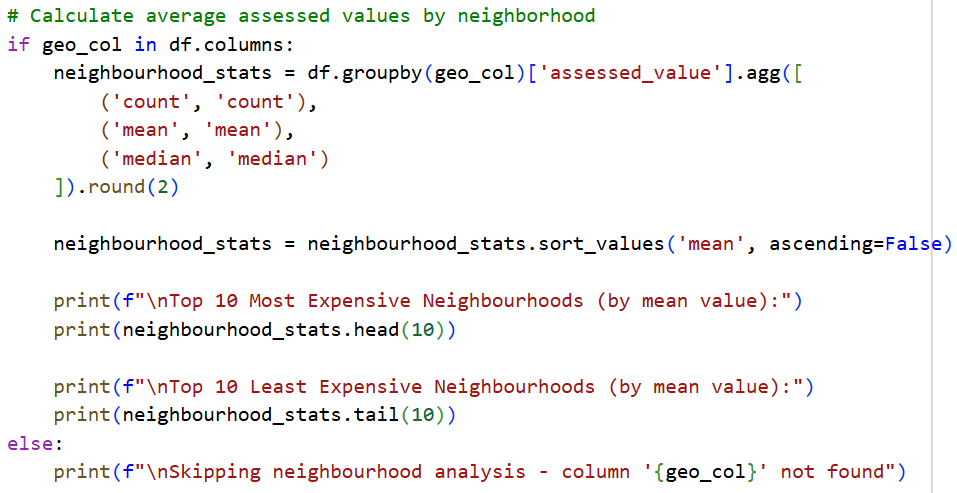
Neighbourhood Statistics.
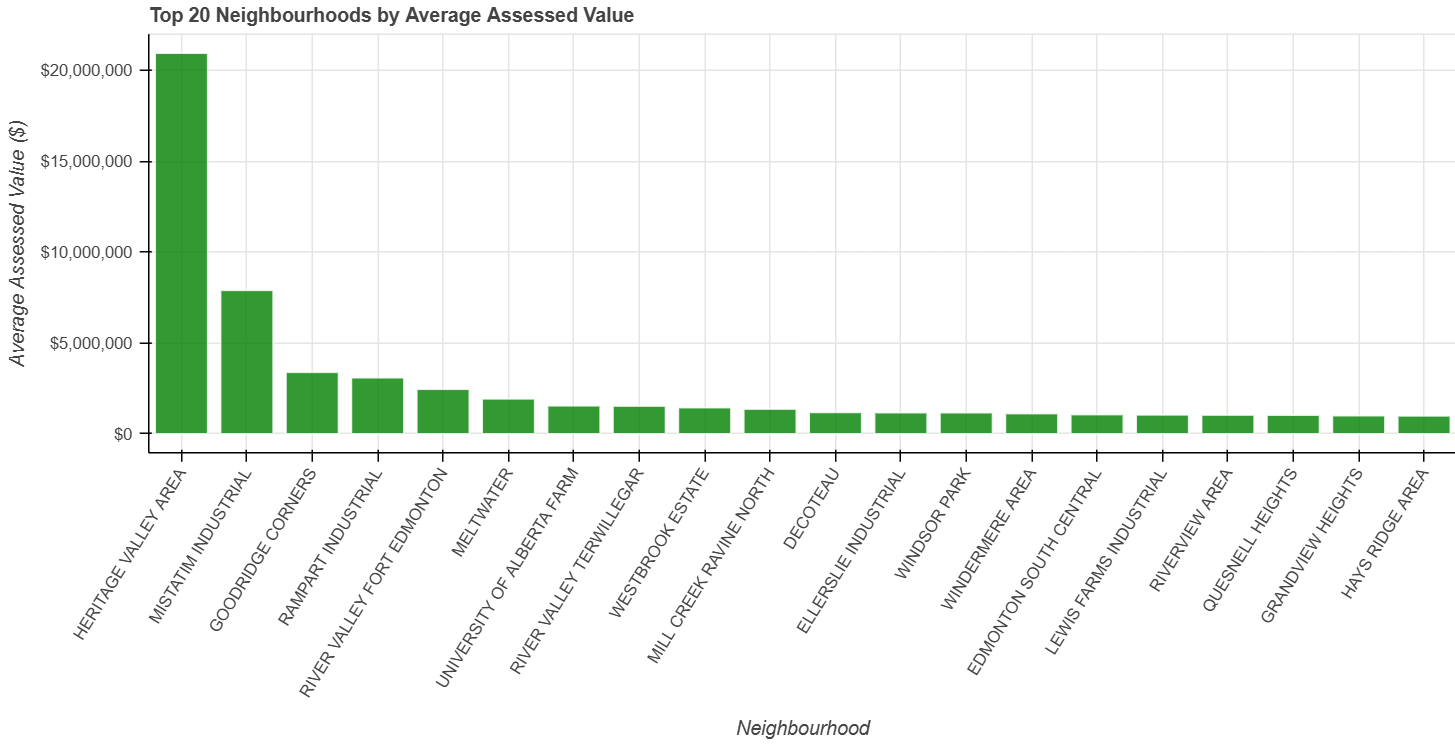
Top 10 Most Expensive Neighbourhoods (by Mean Value)
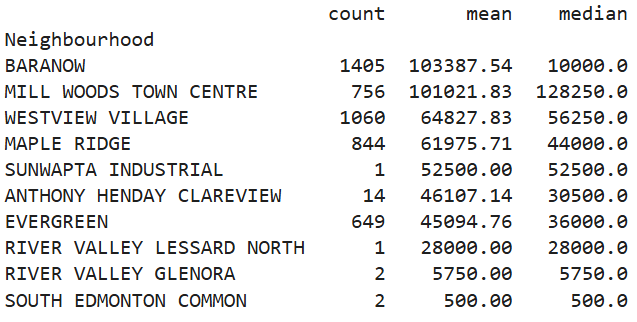
Top 10 Least Expensive Neighbourhoods (by Mean Value)
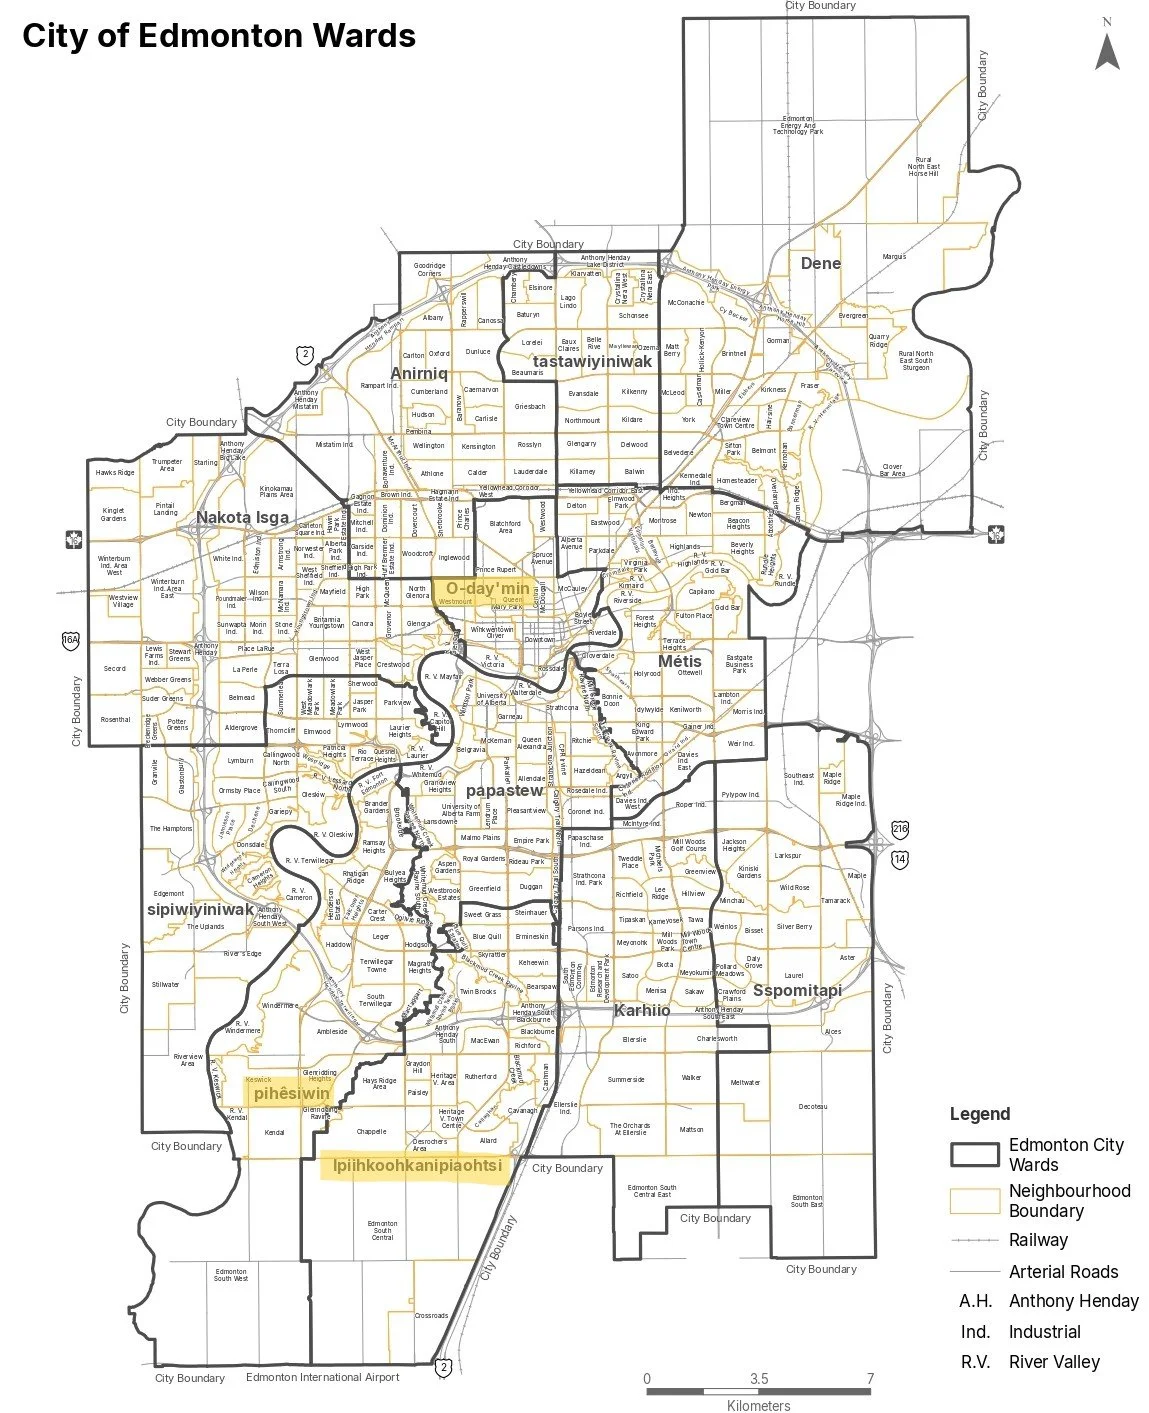
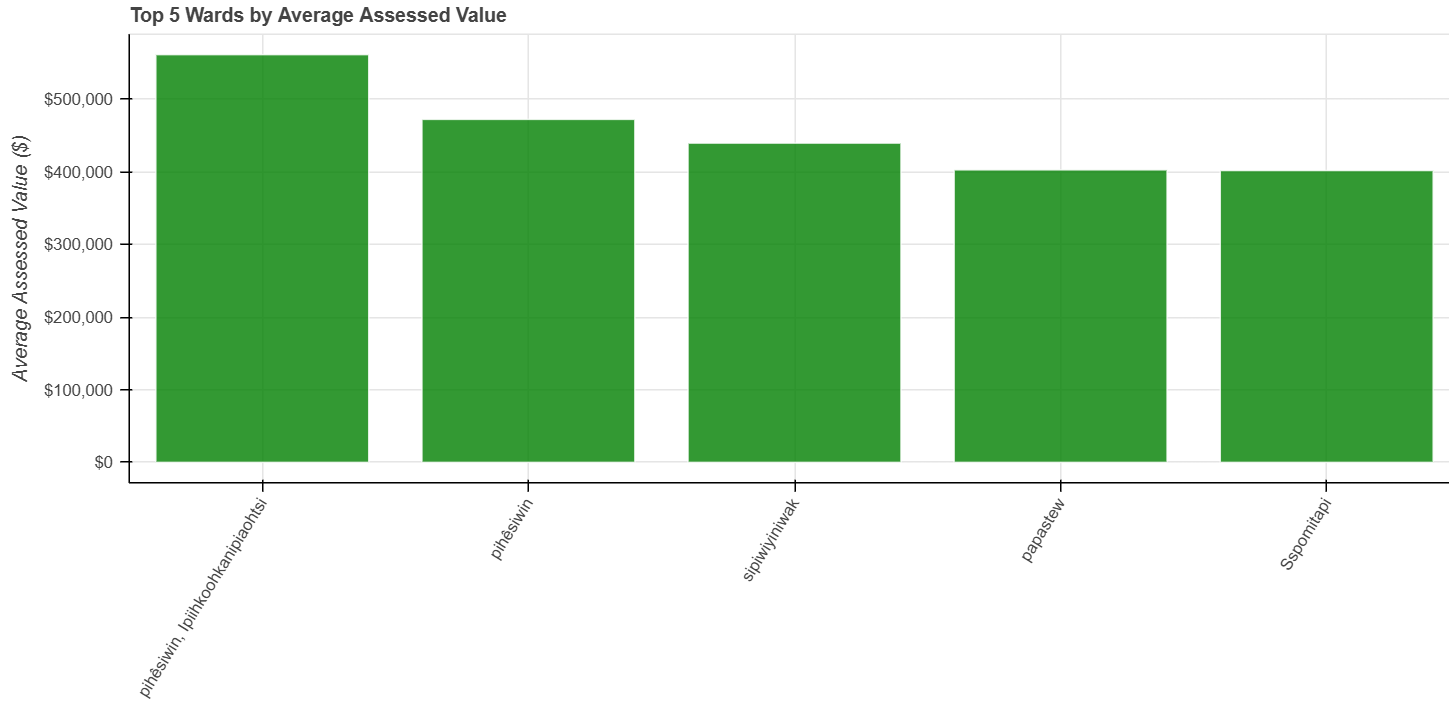
Ward Statistics.
Most Expensive Ward (by mean value)
Pihêsiwin & Ipiihkoohkanipiaohtsi
Least Expensive Ward (by mean value)
O-day'min
Visualizations.
Key Findings.
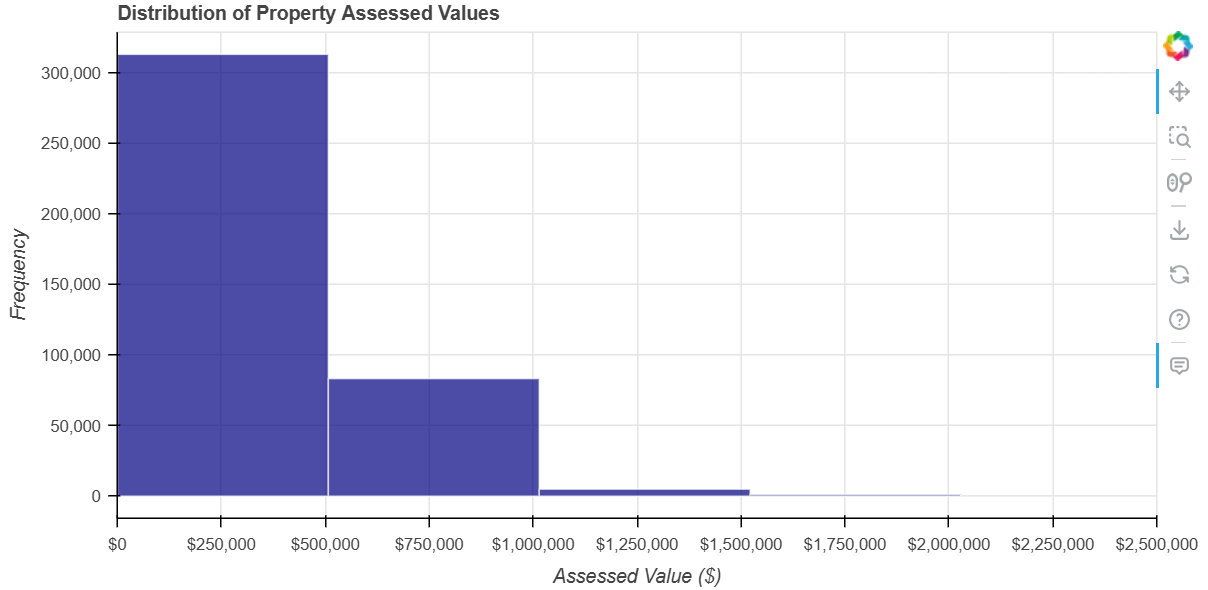
Distribution Most residential properties fall below $500K, with a median assessed value of $367,500. This positions Edmonton as relatively affordable compared to other major Canadian cities.
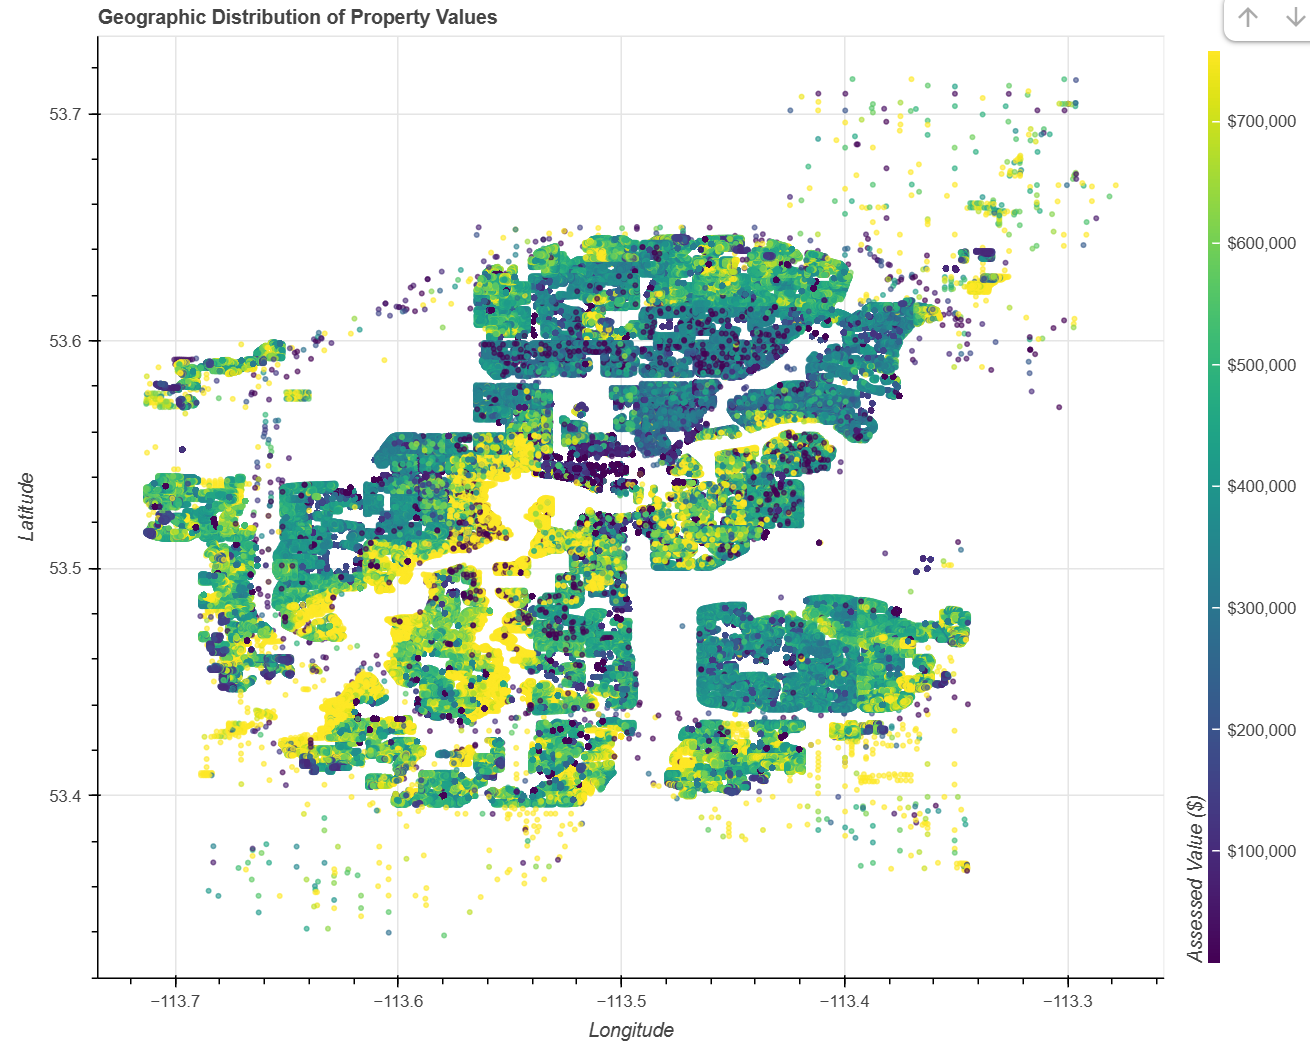
Neighbourhood Extremes The most and least expensive neighbourhoods vary significantly — with high-value properties concentrated in the southwest and central areas, and lower-value properties more distributed across the city.
Ward Level Pihêsiwin & Ipiihkoohkanipiaohtsi had the highest mean property value; O-day'min had the lowest.
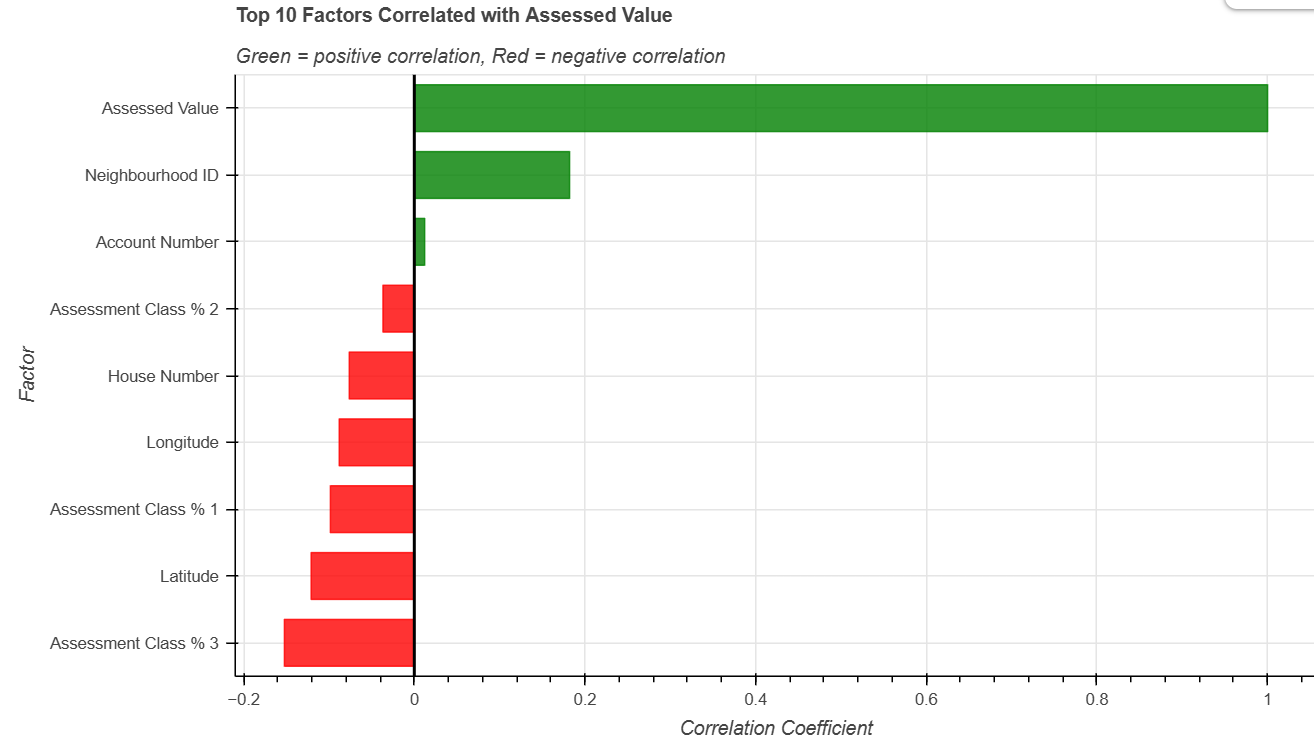
Correlation No strong correlation was found between assessed value and the other variables in this dataset — which is itself a meaningful finding. It points to factors outside this dataset (i.e. school proximity, crime rates, transit access, land use zoning) as more likely drivers of value.
What I'd Do Differently
I'd enrich the dataset with external variables, such as transit proximity, school ratings, walkability scores, to build a more complete picture of what actually drives property values. The current analysis identifies that the correlation is weak; a richer dataset would start to explain why.